Tension tests provide information on the strength and ductility of metals under uniaxial tensile stresses. ASTM E8 Standard Test Methods for Tension Testing of Metallic Materials specifies how to perform the strength and ductility tests for metals. Strength refers to the ability of a structure to resist loads without failure due to excessive stress or deformation. Ductility is a measure of a metals ability to deform under tensile stresses. Ductility is important in metal forming processes, as metals that crack or break under stress cannot be manipulated by hammering, rolling or drawing.
Typical points of interest when testing a metal include: ultimate tensile strength (UTS) or peak stress; offset yield strength (OYS) which represents a point just beyond the onset of permanent deformation; the rupture (R) or fracture point where the specimen separates into pieces; and percent elongation at break.

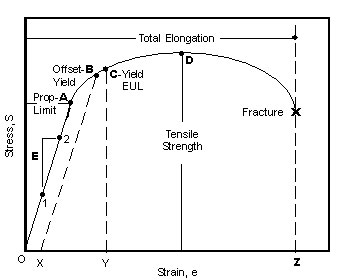
Fig. 1 - Stress vs. Strain Curve
Theory
A graphical description of the amount of deflection under load for a given material is the stress-strain curve (Fig. 1). Engineering stress (S) is obtained by dividing the load (P) at any given time by the original cross sectional area (A) of the specimen.
S = P/A Eq. 1
Engineering strain (e) is obtained by dividing the elongation of the gage length of the specimen (∆l) by the original gage length (lo).
e = ∆l/ lo = (l – lo)/ lo Eq. 2
Figure 1 depicts a typical stress-strain curve. The shape and magnitude of the curve is dependent on the type of metal being tested. Point A represents the proportional limit of a material. A material loaded in tension beyond point A when unloaded will exhibit permanent deformation. The proportional limit is often difficult to calculate, therefore, two practical measurements, offset yield strength (OYS) and yield by extension under load (EUL), were developed to approximate the proportional limit. The initial portion of the curve below point A represents the elastic region and is approximated by a straight line. The slope (E) of the curve in the elastic region is defined as Young’s Modulus of Elasticity and is a measure of material stiffness.
E = ∆S /∆e = (S2-S1)/(e2-e1) Eq. 3
Point B represents the offset yield strength and is found by constructing a line X-B parallel to the curve in the elastic region. Line X-B is offset a strain amount O-X that is typically 0.2% of the gage length. Point C represents the yield strength by extension under load (EUL) and is found by constructing a vertical line Y-C. Line Y-C is offset a strain amount O-Y that is typically 0.5% of gage length. The ultimate tensile strength, or peak stress, is represented by point D. Ultimate tensile strength (UTS), offset yield strength (OYS) and Young's Modulus of Elasticity are properties that define a metals strength.
Total elongation, which includes both elastic and plastic deformation, is the amount of uniaxial strain at fracture and is depicted as strain at point Z. Percent elongation at break is determined by removing the fractured specimen from the grips; fitting the broken ends together and measuring the distance between gage marks. Percent elongation at break reports the amount of plastic or permanent deformation only. The gage length used for measurement is reported with the result.
elongation at break(%) = ez = 100*(lz-lo)/lo Eq. 4
Reduction of area, like elongation at break, is a measure of ductility and is expressed in percent. Reduction of area is calculated by measuring the cross sectional area at the fracture point (Az).
reduction of area(%) = (Ao-Az)/Ao Eq. 5


